
Sheridan County Water Supply Report
May Report
How to Use This Report
What is this report?
Instead of combing the internet and clicking a million links to learn about water supply in Sheridan County, let us do the work for you! This report compiles many trustworthy sources into an easy-to-read and access report. It includes information about streamflow, snowpack, drought, soil moisture, and precipitation for both the Tongue and Powder Rivers. This report is a one-stop shop for information that can help you be aware of water in Sheridan to make decisions for your ranch and your land.
Helpful Hints:
- All forecasts have the word forecast underlined in the page's title.
- Each page has a little blurb at the top that gives you some helpful information.
- If you would like to know more about a topic, check out the sources at the bottom of the page!
- Sources are precise and bring you as close as possible to the original source.
Table of Contents
Drought Index and Change
Drought History and Forecast
Precipitation - Tongue River
Precipitation - Powder River
Reservoir Capacity and Stream Flow
Select Stream Flow Stations
Tongue Water Supply Forecast
Powder Water Supply Forecast
Temperature and Precipitation
Temperature Forecast and Precipitation Forecast
Vegetation Drought Responses and Soil Moisture
Drought Index and Change
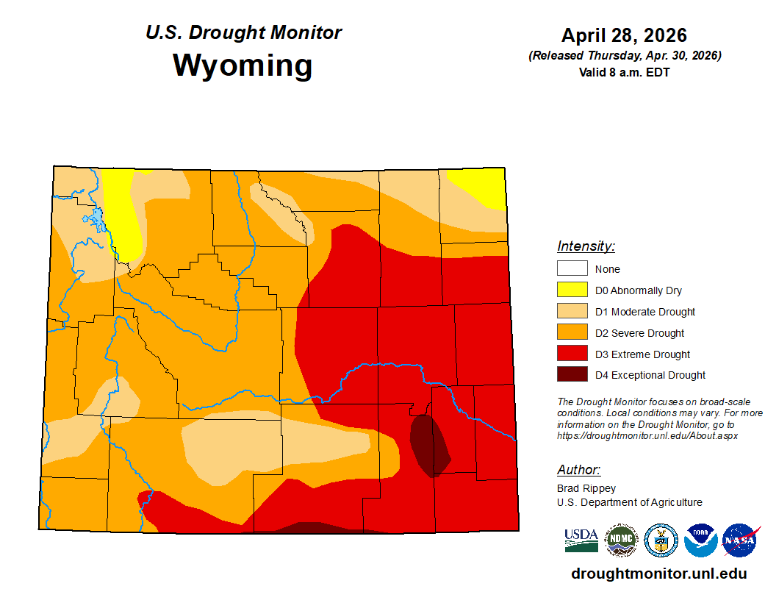
The U.S. Drought Monitor gives you a broad overview of the drought conditions in the US. Its strength is bringing together many ways of determining drought. It is useful as a large-scale view of drought, but local drought resiliency efforts are not considered.
All of Sheridan County is continuing to see worsening drought conditions, with more than 3/4 classified as Severe Drought. Almost all of Wyoming is experiencing drought conditions, with the southeast portion of the state the most dry.
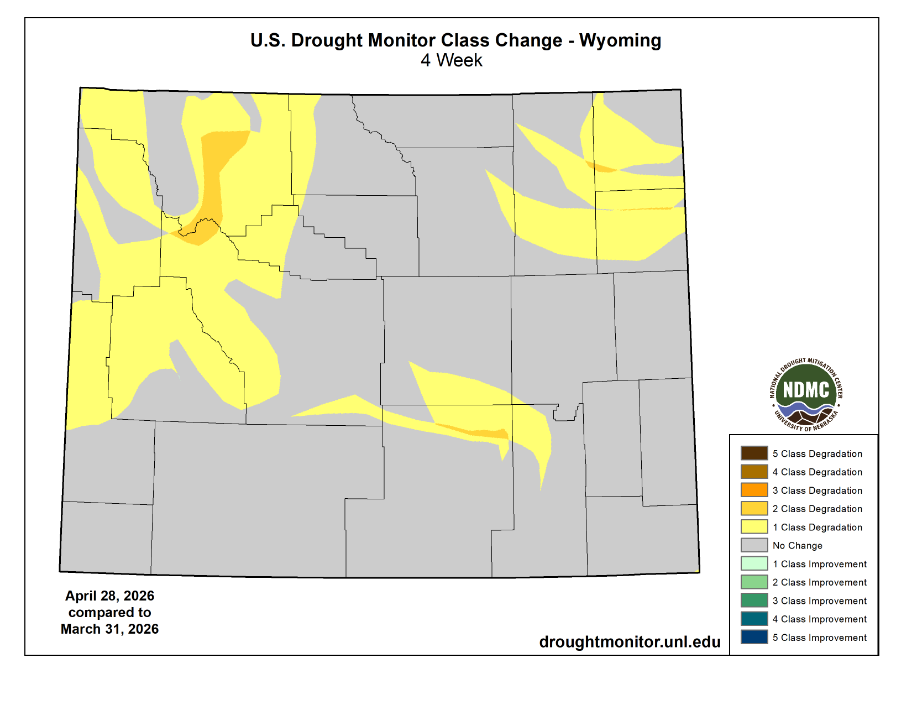
Over the past month, Sheridan saw no change in drought conditions. Statewide, drought conditions worsened compared with last month.
https://droughtmonitor.unl.edu/Maps/MapArchive.aspx
https://droughtmonitor.unl.edu/Maps/ChangeMaps.aspxhttps://droughtmonitor.unl.edu/Summary.aspx
Drought History and Forecast
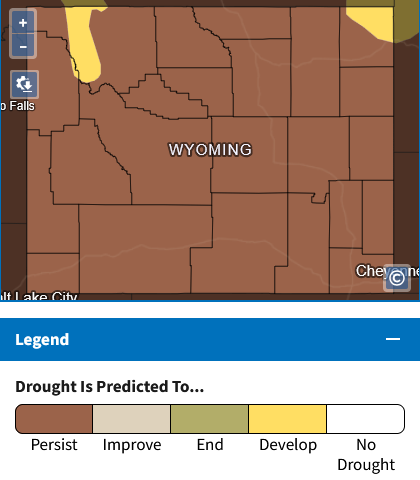
The first half of this page details drought conditions in the last year to today, followed by the seasonal outlook. This forecast provides a prediction of whether drought is expected to persist, improve, or develop over the coming month, helping local producers and residents anticipate changes in water availability.
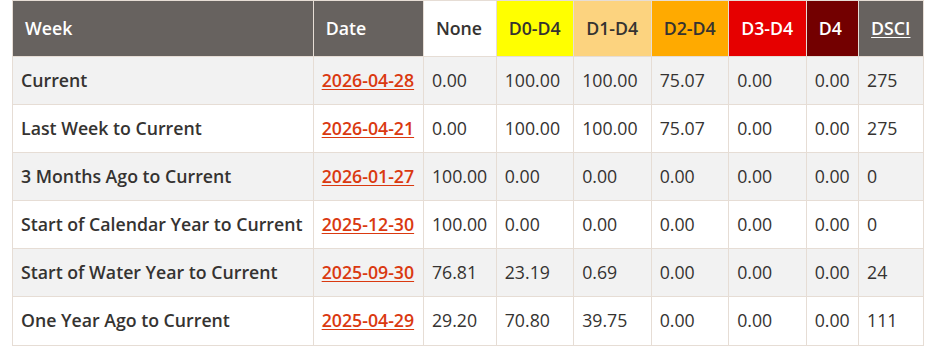
Drought conditions have worsened since last month in Sheridan County. 100% of the county is experiencing some degree of dryness or drought, up from 0% three months ago.
Looking ahead for the month, NOAA forecasts show that the drought will persist in Sheridan County.
https://droughtmonitor.unl.edu/CurrentMap/StateDroughtMonitor.aspx?fips_56033
https://www.drought.gov/forecasts
1https://www.cpc.ncep.noaa.gov/products/expert_assessment/mdo_summary.php
https://www.cpc.ncep.noaa.gov/products/expert_assessment/mdo_discussion.php
https://droughtmonitor.unl.edu/Summary.aspx
Precipitation - Tongue River
These graphs represent precipitation affecting the Tongue River. Snow Water Equivalent (SWE) represents the amount of water contained within the snowpack when it melts.
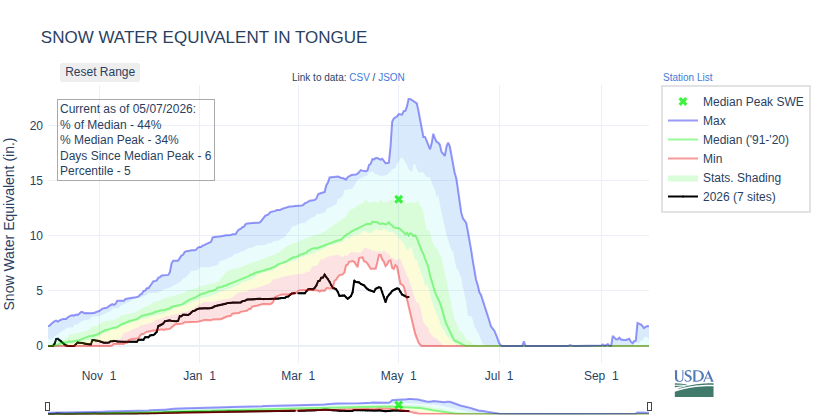
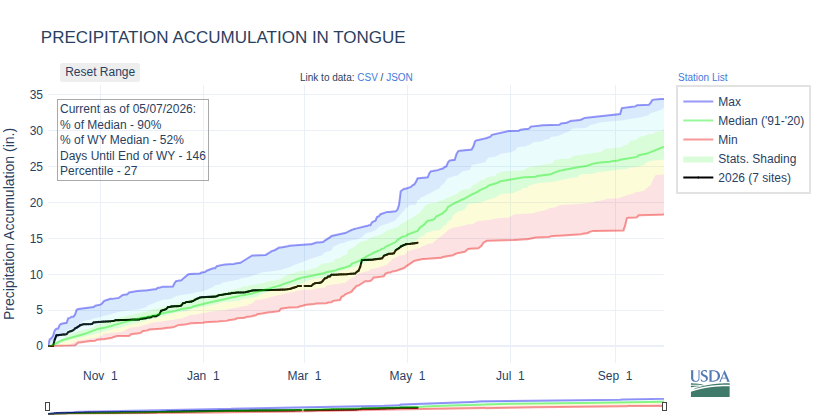
Snow Water Equivalent is at approximately 4.5 inches. This is well below normal for this time of year with peak flow already happening.
Precipitation accumulation is below normal for this time of year.
https://nwcc-apps.sc.egov.usda.gov/awdb/basin-plots/POR/WTEQ/assocHUCwy_8/tongue.html
https://nwcc-apps.sc.egov.usda.gov/awdb/basin-plots/POR/PREC/assocHUCwy_8/tongue.html
Precipitation - Powder River
These graphs represent precipitation affecting the Powder River. Snow Water Equivalent (SWE) represents the amount of water contained within the snowpack when it melts.
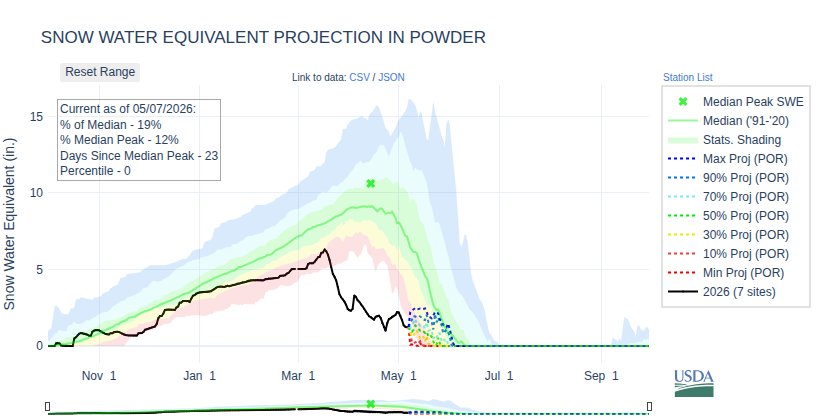
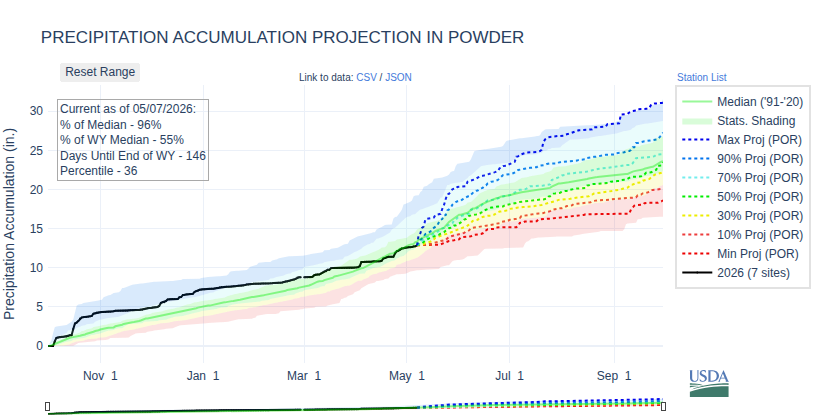
Snow Water Equivalent is approximately 2 inches, which is below normal for this time of year with peak flow already happening.
Precipitation accumulation is normal for this time of year.
https://nwcc-apps.sc.egov.usda.gov/awdb/basin-plots/POR/WTEQ/assocHUCwy_8/powder.html
https://nwcc-apps.sc.egov.usda.gov/awdb/basin-plots/POR/PREC/assocHUCwy_8/powder.html
Reservoir Capacity and Stream Flow
The total capacity of reservoirs and current water storage includes inactive storage below the outlet.
Lake DeSmet
Water storage level is at 200,937 ac/ft. Total Capacity if 234,987 ac/ft. The lake is 85.5% full.
| Reservoir | Total Storage (Acre-ft) | Current Storage (Acre-ft) | Percentage of Total Capacity (%) |
|---|---|---|---|
| Bighorn | 4,624 | 1,975 | |
| Cross Creek | 824 | 260 | |
| Dome Lake No. 1 | 1,506 | 1,354 | |
| Kearney Lake | 6,324 | 3,575 | |
| Park Lake | 10,362 | 4,813 | |
| Sawmill | 1,275 | 653 |
Tongue River Reservoir
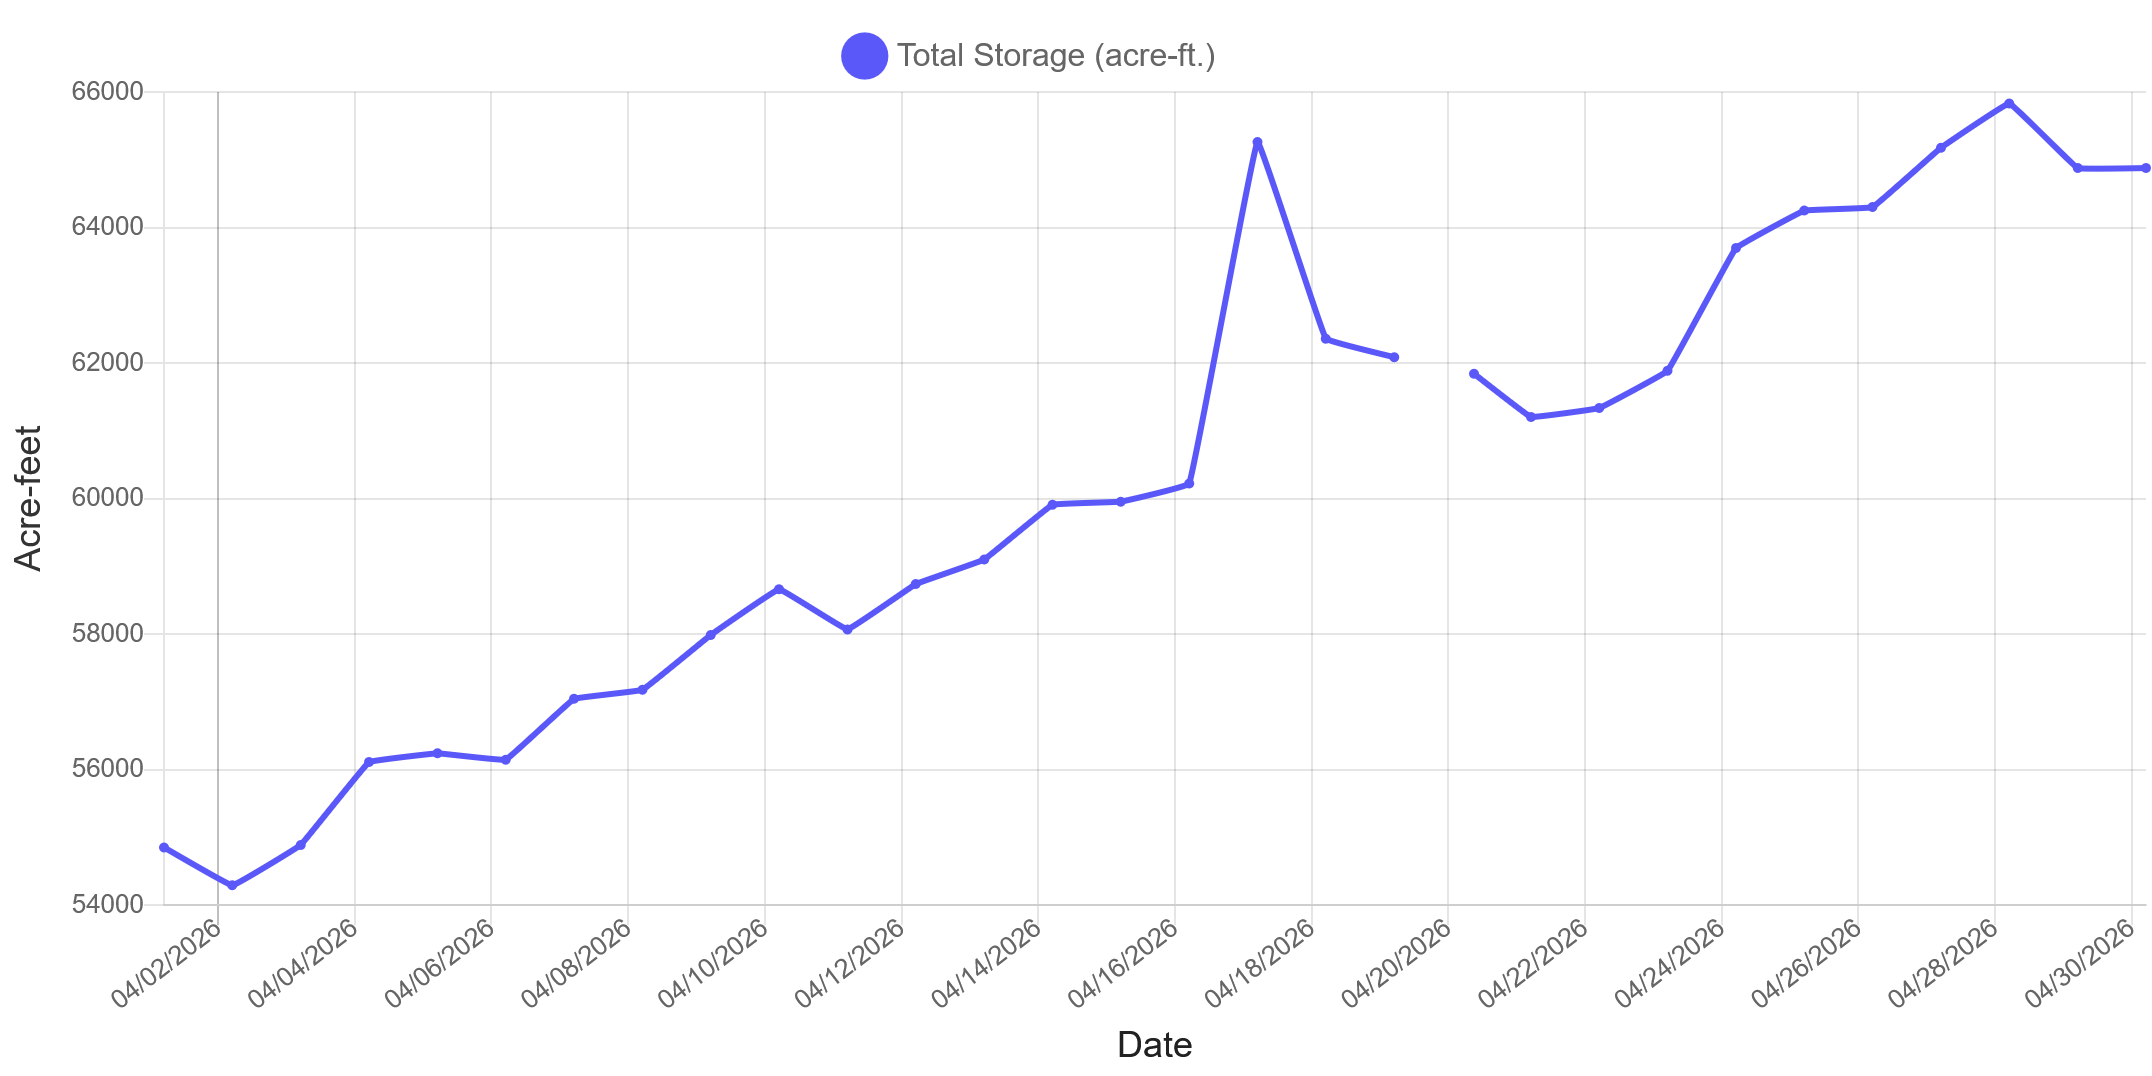
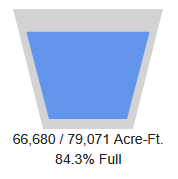
Water levels have increased to 66,680 ac/ft. The reservoir is 84.3% full.
Reservoir Level
This graph displays the real time data of the Tongue River Reservoir. This data remains provisional until it is officially reviewed due to variables that can affect the gages. These include but are not limited to algal and aquatic growth, sediment movement, malfunction of recording equipment, and back water from ice or debris such as log jams.
Sources:Lake DeSmet Operating Department at lakedesmet@johnsoncowy.us
https://seoflow.wyo.gov/Data/Map/Parameter/Total%20Storage/Location/Identifier/Interval/Latest
https://gis.dnrc.mt.gov/apps/stage/gage-report/location/3f087fe86bde421f857dfedff4e40e93/1680476400000-1683154740000
Select Stream Flow Stations
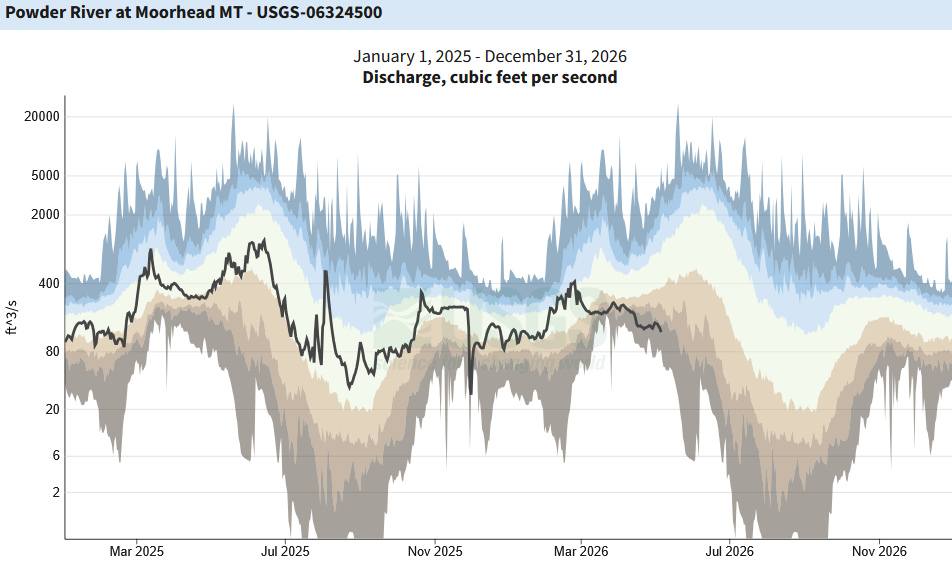
These graphs provide context for streamflow percentile classes. The selected USGS stream gages are located near the state line, with Montana representing the downstream end of the Tongue and Powder Rivers within our region. Reported flow values represent the average seven-day flows. The vertical axis is logarithmic, meaning each major tick mark represents a tenfold (10×) increase.
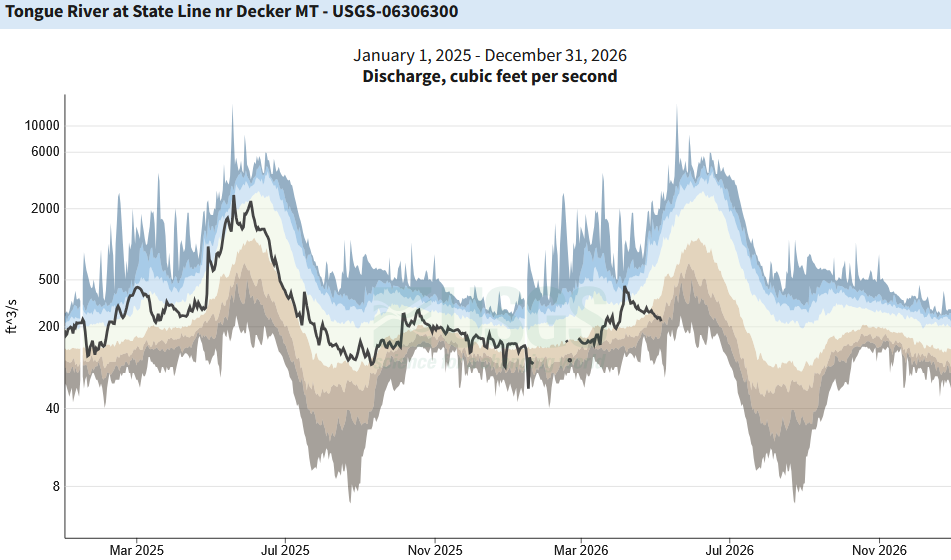

Streamflow is in the portion of the "Much Below" range or 5-10th percentile.
Streamflow is in the bottom portion of the "Extremely Below" range or 0-5th percentile.

https://waterwatch.usgs.gov/index.php?id=mv01d
https://waterwatch.usgs.gov/?id=wwchart_sitedur&ofmt=plot_mvbg&site_no=06306300
https://waterwatch.usgs.gov/?id=wwchart_sitedur&ofmt=plot_mvbg&site_no=06324500
Temperature and Precipitation
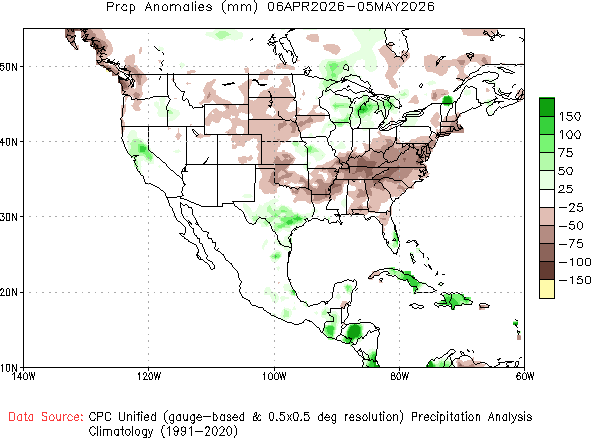
Temperature and precipitation are large drivers of changes in drought conditions. As you might expect, high temperatures and low precipitation can worsen drought conditions while low temperature and high precipitations can improve them.
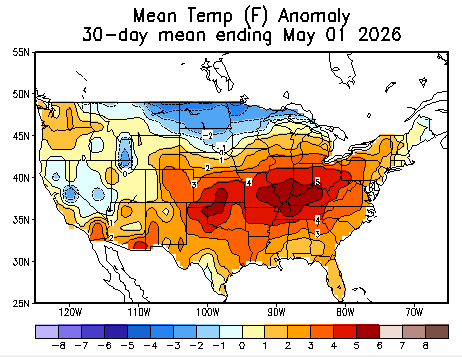
Last month was 0 - 1 degrees warmer in Sheridan County than most years.
The precipitation anomaly for Sheridan County was below normal last month.
https://www.cpc.ncep.noaa.gov/products/tanal/temp_analyses.php
https://www.cpc.ncep.noaa.gov/products/Global_Monsoons/American_Monsoons/NAMS_precip_monitoring.shtml
https://www.cpc.ncep.noaa.gov/products/expert_assessment/mdo_discussion.php
https://www.weather.gov/byz/daily_records?city=Sheridan
Temperature Forecast and Precipitation Forecast
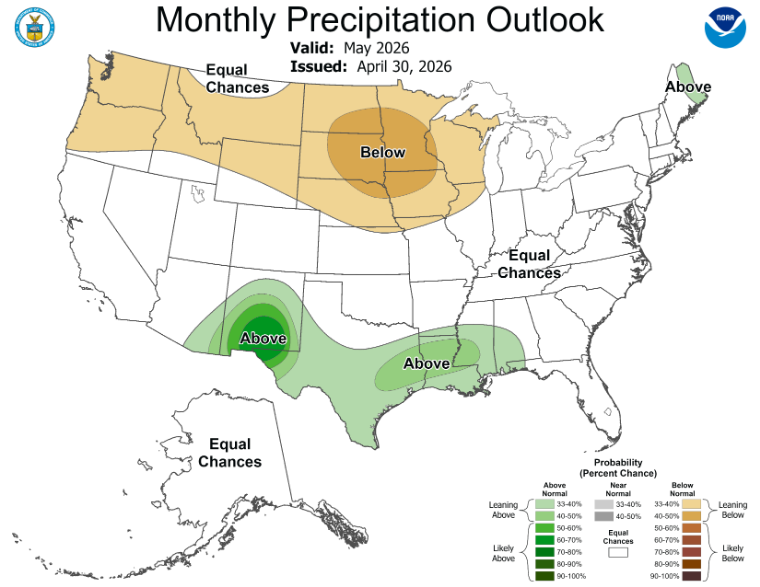
Explore the link for an interactive map that displays the percentage chance of above- or below-normal conditions for any point in the United States.
https://www.cpc.ncep.noaa.gov/products/predictions/long_range/lead14/interactive/index.php
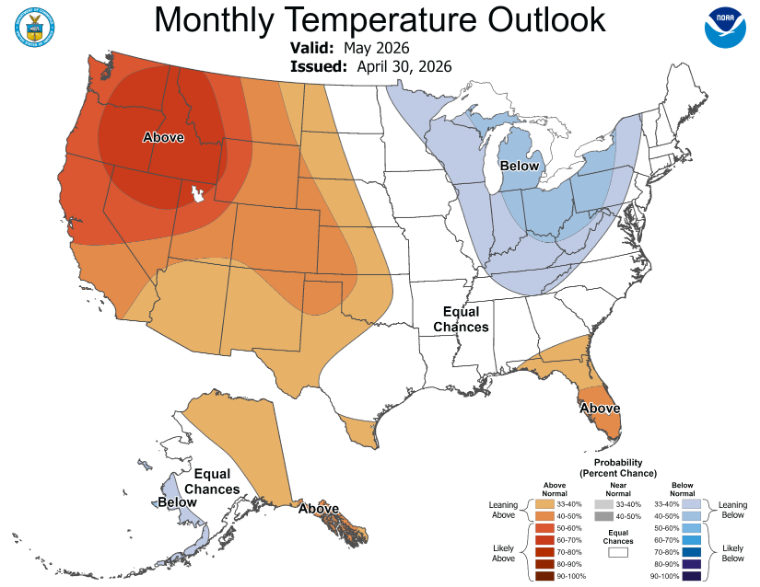
Sheridan county has an 40-50% probability to have higher temperatures this month than normal.
Sheridan has a 33-40% chance of below normal outlook for precipitation this month.
https://www.cpc.ncep.noaa.gov/
https://www.cpc.ncep.noaa.gov/products/predictions/long_range/lead14/interactive/index.php
https://www.cpc.ncep.noaa.gov/products/expert_assessment/mdo_discussion.php
Vegetation Drought Responses and Soil Moisture
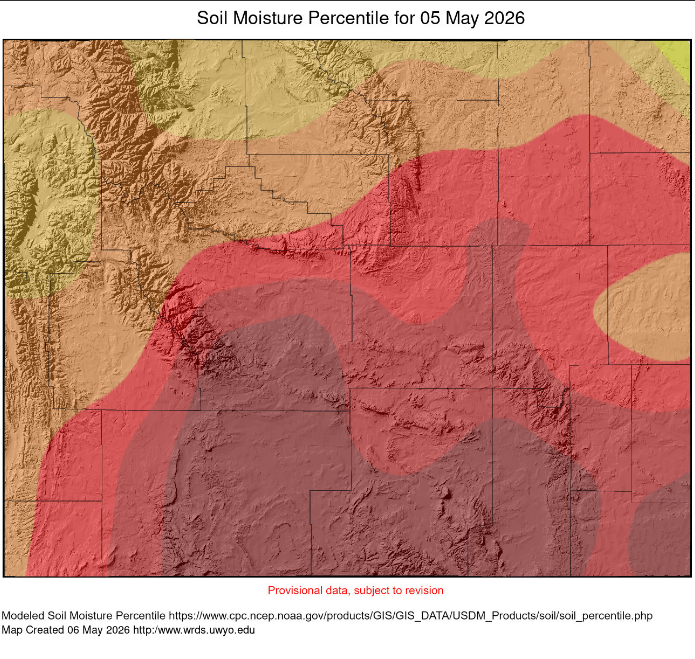
The graphs below present two ways of visualizing on-the-ground conditions. The Vegetation Drought Response Index (VegDRI) uses satellite data to estimate vegetative stress. Soil moisture is also a valuable indicator. Because soil acts like a moisture bank, it can buffer short-term drought degradation or improvement. Soil moisture also represents the water available to plants and is therefore closely linked to vegetative stress.
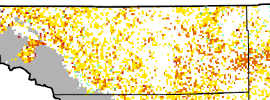
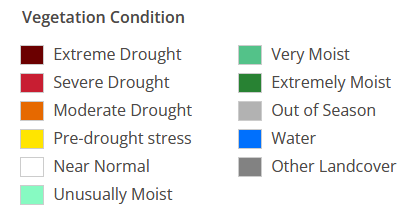
Vegetation Drought Response is showing Pre-Drought and Moderate Drought across much of the county.
Soil moisture percentiles fall in the 20–40% range across the county.
https://vegdri.unl.edu/Home/VegDRIQuad.aspx?WY,2
https://www.cpc.ncep.noaa.gov/products/Soilmst_Monitoring/US/Soilmst/Soilmst.shtml
http://www.wrds.uwyo.edu/Soil/SM-Ptile-Current.html
Additional Resources
These are the broad sources we got information from. These websites are trustworthy and are reliable sources for additional information. In the future we hope to add more source for additional information.
- https://droughtmonitor.unl.edu
- https://www.drought.gov
- https://www.cpc.ncep.noaa.gov
- https://www.nrcs.usda.gov/wps/portal/wcc/home
- https://waterwatch.usgs.gov
- Lake DeSmet Operating Department at lakedesmet@johnsoncowy.us
- http://dnrc.mt.gov/divisions/water/projects/tongue-river
- https://seoflow.wyo.gov/Data/Map/Parameter/Total%20Storage/Location/Identifier/Interval/Latest
- https://vegdri.unl.edu/Home/VegDRIQuad.aspx?WY,2